Last month we shared some surprising new data, showing how London rents had dropped as much as 28% in some postcodes – with the average cost in the capital as a whole falling 7% year on year, as a result of the global pandemic and subsequent lockdown period.
A few weeks later and rents in the capital are still down – way down in some areas.
Here are the 20 postcodes with the biggest drops:
- W8 (Holland Park) – down 18%
- SW10 (West Brompton / Chelsea) – down 18%
- NW8 (St John’s Wood) – down 17%
- W9 (Maida Vale / Paddington) – down 15%
- SW6 (Fulham) – down 14%
- N5 (Highbury) – down 14%
- SW8 (South Lambeth) – down 14%
- W14 (West Kensington) – down 13%
- NW1 (Camden) – down 13%
- N1 (Angel / Islington) – down 13%
- W10 (North Kensington) – down 12%
- SE11 (Kennington) – down 11%
- SW12 (Balham) – down 9%
- WC1 (Bloomsbury / High Holborn) – down 9%
- E2 (Bethnal Green) – down 8%
- N7 (Holloway) – down 8%
- NW3 (Hampstead) – down 8%
- W11 (Notting Hill) – down 7%
- SW5 (Earl’s Court) – down 7%
- NW5 (Kentish Town) – down 7%
We've never seen London rents down like this – and while it's impossible to know right now if this is just a temporary dip or a sign of things to come, we do know that now could be a great time to find a new room in London.
This London data compares July 2020 with July 2019. It incorporates data – includes average monthly room rents and supply – from over 82,000 rooms in shared accommodation (inclusive of bills). London data covers E, EC, N, NW, SE, SW, W & WC postcode districts
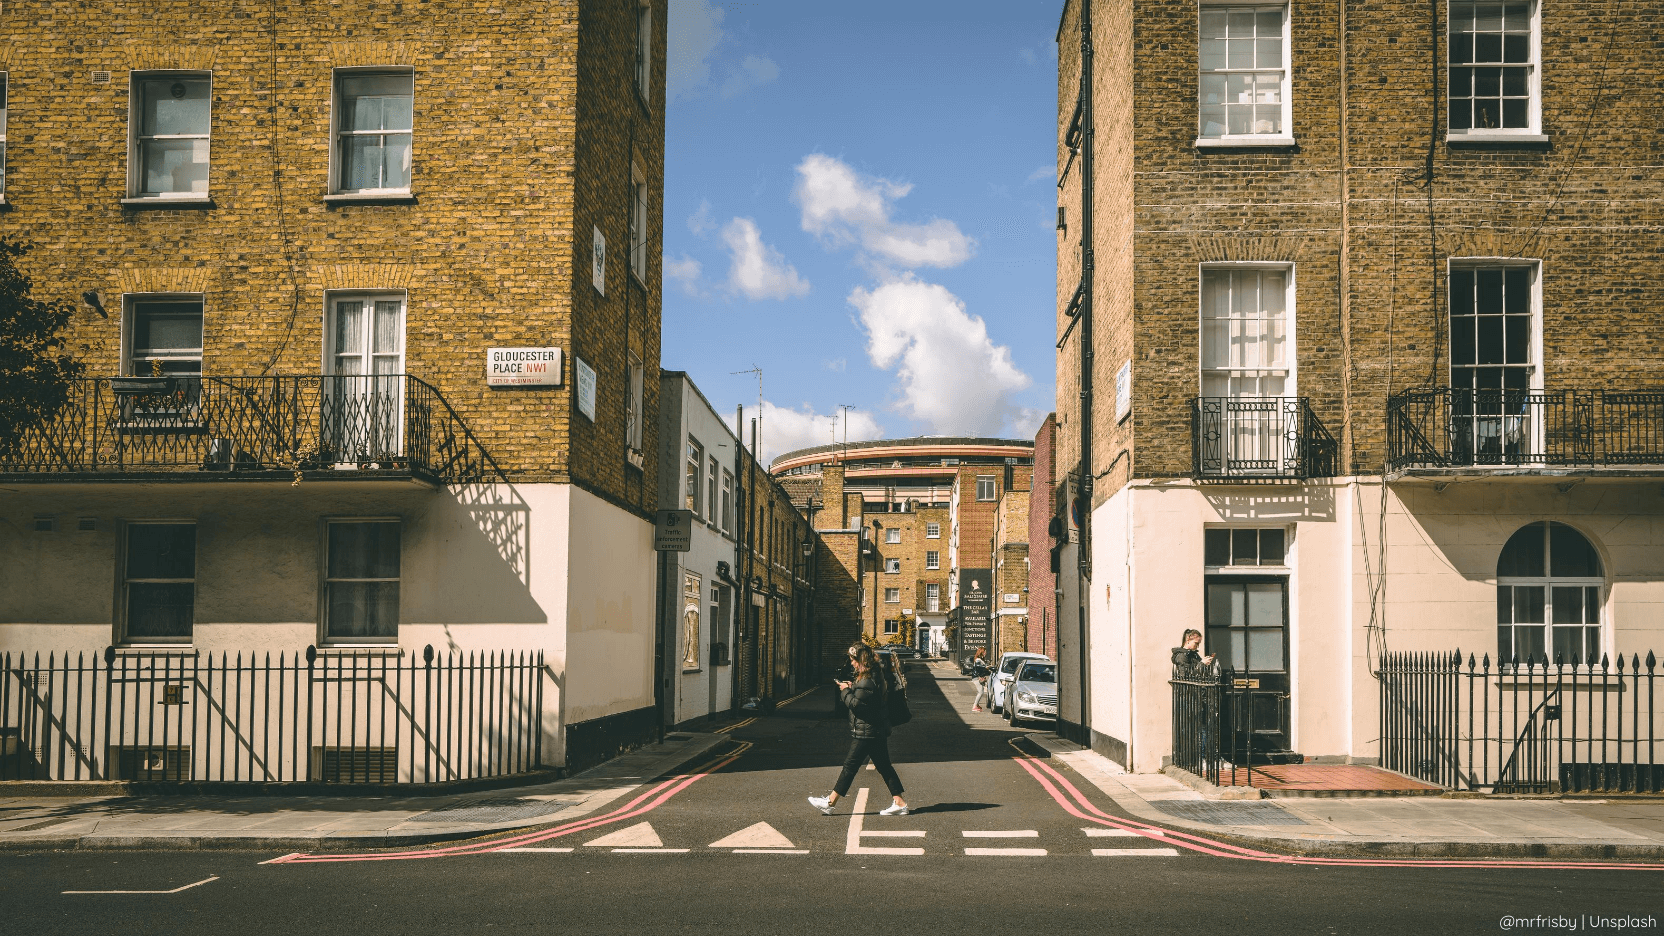
Image credit: @mrfrisby.
